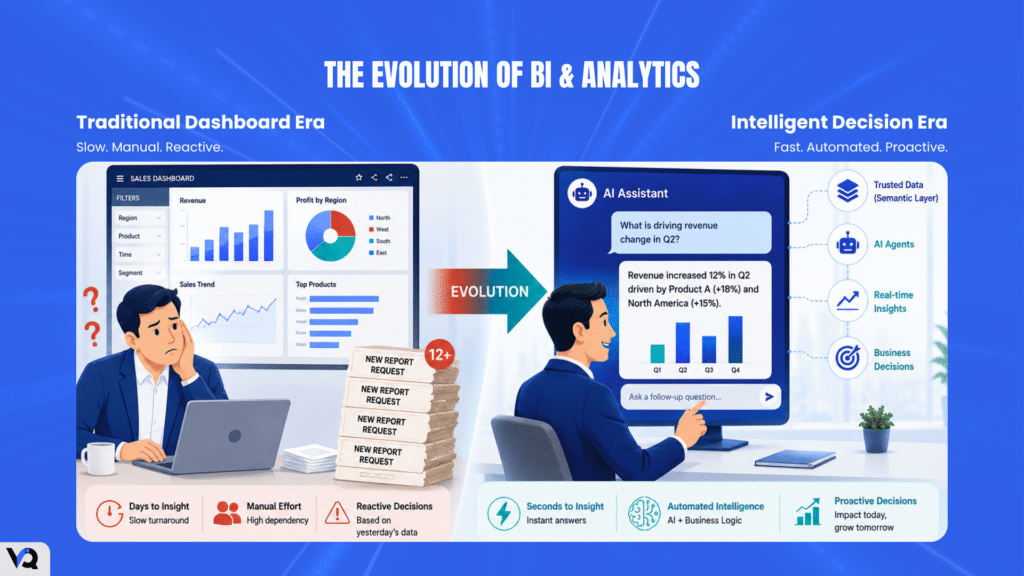
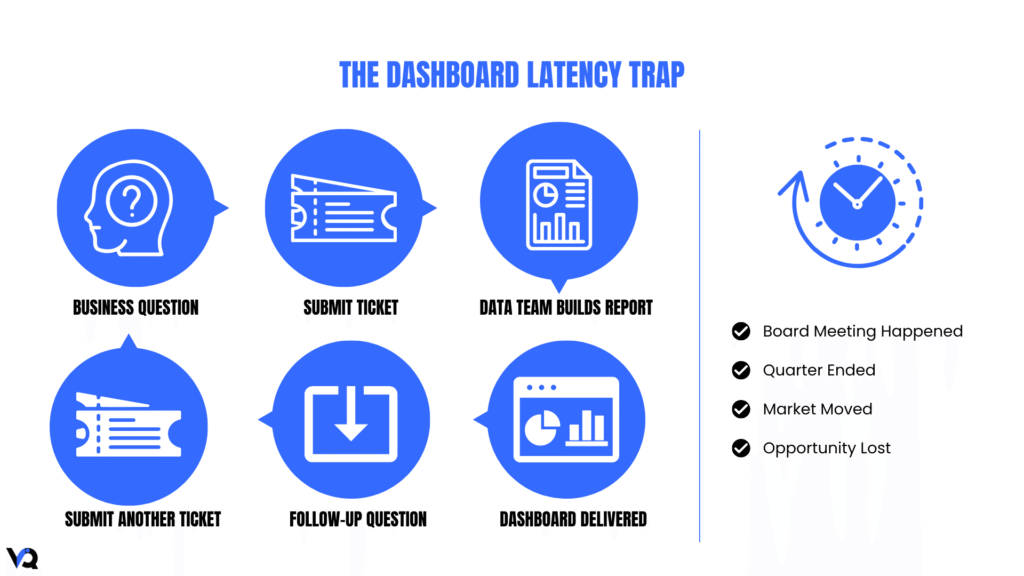
Walk into almost any corporate data department, and you will spot a familiar routine. A business leader needs an answer. They submit a ticket. The data team spends three days building a beautifully color-coded dashboard. The user looks at it, has a follow-up question, and submits another ticket.
For years, this was the gold standard of Business Intelligence (BI), giving non-technical teams visual data access without writing SQL, or playing with various data sources such as data marts, data warehouse, data lakes etc.
But, to be honest, we believe that the traditional dashboard-first era is coming to a close.
As a Senior Leader at a business, you aren’t running a graphic design studio; your goal is to drive fast, accurate organizational outcomes to impact top and the bottom line.
The evolution of BI & Analytics is no longer about creating prettier charts. It is about shifting from passive layouts to automated, real-time smart choices with a pinch of AI being part of the outcome. At VantageIQ Technologies, we believe it’s time for enterprise data to get a true glow-up, moving beyond static dashboards toward governed semantic layers, intelligent data pipelines, and AI-driven conversational decision making.
The Latency Trap: Why Your Shiny Dashboards Are Already Outdated
The biggest flaw of the traditional dashboard is latency. The time between a critical question and an actionable answer is measured in days. By the time an engineering team builds and distributes a report, it’s already too late, your quarter is over, that important board meeting took place, the investor that wanted to go through specifics moved on etc.
Dashboards & Reports assume that business questions are fixed and predictable. However, real-world business operations move too quickly for hindsight. Look at the corporate regulatory landscape: global compliance reports show that major firms faced over $400 million in fines purely due to “systems and control failures.”
Regulatory bodies explicitly warned that relying on static, backward-looking metrics prevents companies from catching operational risks early.
If your data environment only shows a crisis after it happens on a weekly scorecard, the dashboard hasn’t solved the problem, it has merely shown it on the dashboard.
To find answers, users must apply endless filters or submit another request. This causes massive “dashboard fatigue” ultimately costing the most important resource of senior leadership function of an enterprise, i.e. THE TIME! Enterprises are drowning in thousands of unused reports that consume engineering and leadership hours but deliver very little impact on either the revenue or the margins.
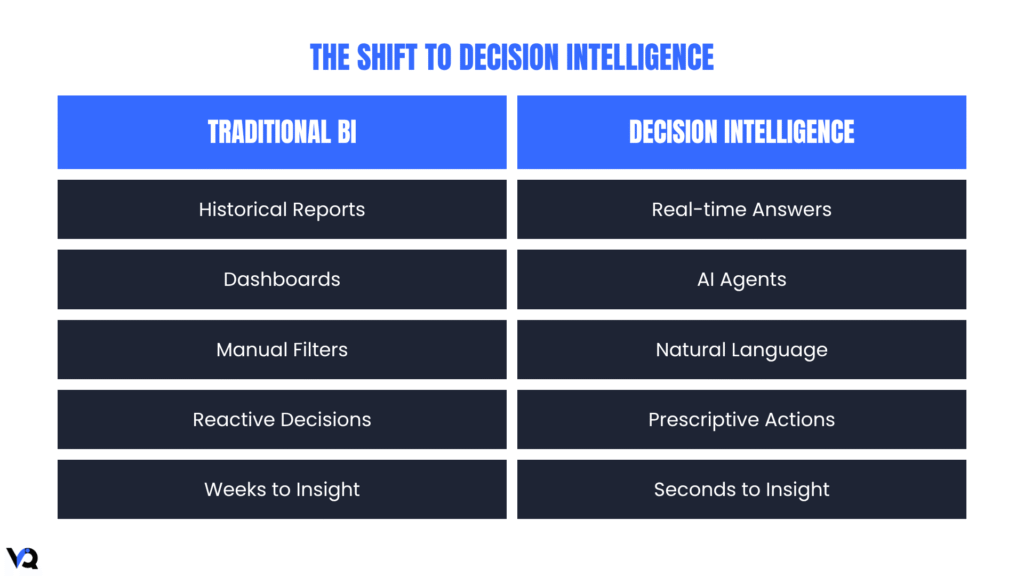
Enter Decision Intelligence: A $20 Billion Shift in Enterprise Strategy
This frustration is driving a major market correction toward Decision Intelligence (DI), shifting from passive descriptive analytics to active, prescriptive frameworks.
According to recent market intelligence from Research and Markets, the global decision intelligence sector is exploding. It is projected to grow from roughly $17.4 billion last year to over $20.7 billion this year alone, boasting a compound annual growth rate (CAGR) of 19.1%.
This is the next level of Analytics consumption where senior leaders of the business no longer want to sit in front of screens guessing what a bar chart implies. They want dynamic answers grounded in trusted data and connected directly to action, whether that means reallocating marketing spend, identifying operational bottlenecks, forecasting demand, or mitigating compliance risk in real time. Gartner’s latest predictions highlight this clearly: the boundaries between human, machine, and organizational intelligence are blurring. Leaders who fail to modernize their approach risk leaving their companies permanently behind.
The New Foundation: Trading UI for a Universal Semantic Layer
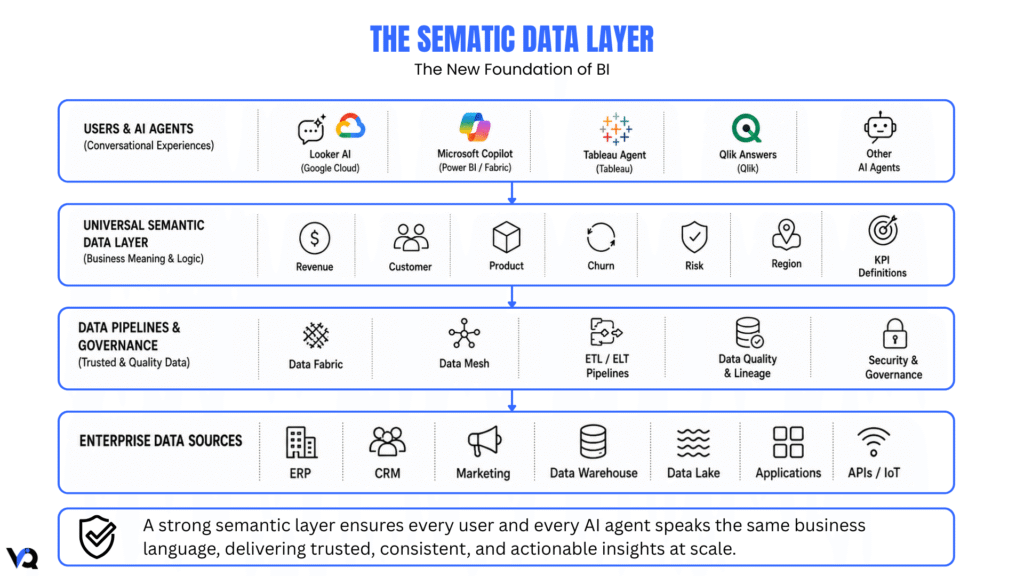
If dashboards and reports are no longer the primary interface for business users, what comes next? The short answer: AI agents and conversational analytics experiences built on top of a rock-solid, universal semantic data layer.
With open frameworks like the Model Context Protocol (MCP) and conversational engines integrated directly into modern data platforms, the user interface is fundamentally changing. Google Cloud’s Looker is embedding generative AI directly into analytics workflows, Microsoft Fabric and Power BI are enabling natural-language interactions through Copilot and semantic models, Tableau is evolving toward agentic analytics with Tableau Agent and AI-powered semantic data layers, while Qlik is pushing conversational decision support through Qlik Answers. Business users no longer need a maze of tabs and dashboards; they simply ask plain-language questions and receive context-aware answers grounded in trusted enterprise data.
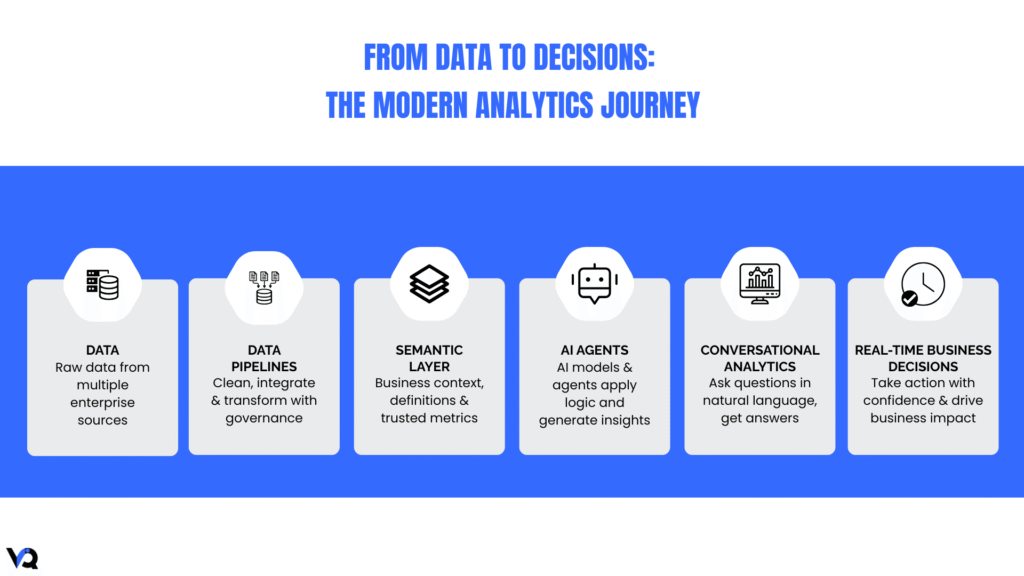
In seconds, the AI queries the warehouse, applies specific business logic, and generates a precise summary alongside the required metrics.
But there is a major catch. AI tools can hallucinate, especially when dropped into messy, raw database tables. That is why the evolution of BI & Analytics depends heavily on strong data governance. For AI to generate reliable answers, it needs a semantic data layer, a centralized translator that unifies definitions like “revenue” and “churn” across the enterprise and ensures every user and every AI agent is working from the same business logic.
Google Cloud’s engineering data shows that mapping your data through a structured semantic model reduces generative AI query errors by up to two-thirds. This is precisely why the world’s leading analytics platforms are investing so heavily in semantic models. Google Cloud’s Looker, Microsoft Fabric’s semantic models, Tableau’s AI-infused semantic layer, and Qlik’s governed analytics framework all recognize that AI is only as trustworthy as the business context and governance sitting beneath it.
The shift is already underway across the analytics ecosystem. Microsoft is embedding Copilot and semantic models across the Fabric platform, Tableau is building agentic analytics experiences powered by trusted semantic layers, Qlik is introducing AI assistants that combine structured and unstructured enterprise data, and Google Cloud continues to evolve Looker into a conversational analytics interface. Different vendors are taking different paths, but the destination is remarkably similar: moving from dashboards that describe the past to AI systems that help businesses decide what to do next.
The Playbook for Modern BI & Analytics Directors & Leaders
For BI & Analytics leaders, navigating this transition requires a complete mindset reset. How do you prepare your data engineering team for a world without dashboards?
- First, stop building and start modeling. Shift your engineers’ focus away from building custom, ad-hoc reports for individual teams. Instead, task them with constructing and maintaining a robust, universal semantic data layer.
- Second, prioritize smart data pipelines. Your AI models and conversational agents are only as good as the infrastructure supporting them. Focus on high-performance data engineering, data fabrics, or mesh architectures that safely transform raw data into strategic assets.
- Finally, embrace multi-agent orchestration. Build an enterprise ecosystem where AI agents can safely interact with governed data to automate complex workflow decisions.
Ultimately, the competitive advantage will not come from having more dashboards than your peers. It will come from building an architecture where governed data, intelligent automation, and AI agents work together to shorten the distance between a business question and a business decision.
Moving Beyond the Chart
Traditional Analytics and BI tools won’t vanish overnight. There will always be a place for executive scorecards, operational monitoring, and highly regulated reporting. But for fast-moving organizations, dashboards are increasingly becoming one interface within a broader, AI-powered decision intelligence ecosystem.
The future belongs to organizations that build resilient, future-ready architectures where data is immediate, conversational, and tightly bound to real-time execution. Don’t let your analytics department get stuck in an endless report-building loop. Free your data from the dashboard constraint, and give your business the clarity it needs to move at the speed of digital.