Across Chapters 1–9, we’ve traced the evolution of GCCs from transactional back-offices into strategic engines, explored the talent, operating models, AI, governance, and legal realities behind that shift, and examined India’s scale, talent pools, tech hubs, and cost structures shaping where companies build.
This final post brings it all together into a straightforward financial and operational playbook for leaders across North America and Western Europe.
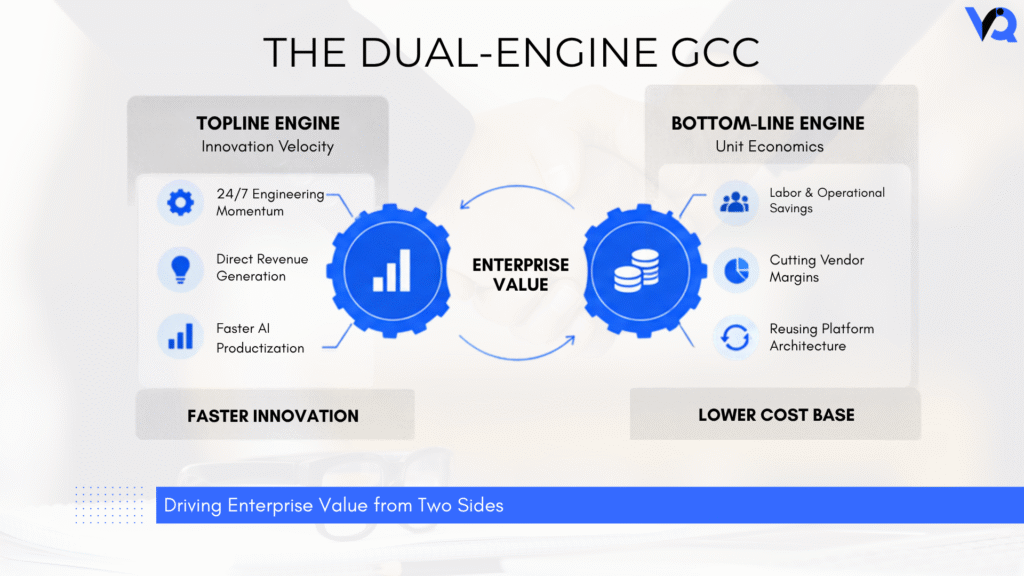
For executives across North America and Western Europe, setting up or revamping a GCC is no longer a simple exercise in trimming costs. It’s a dual-engine strategy designed to do two things at once: accelerate product innovation and fundamentally improve operational economics.
Speeding Up the Top Line vs. Protecting the Bottom Line
The true financial case for a GCC comes down to two complementary sides of the coin:
Topline Growth Drivers
- 24/7 Engineering Momentum: Cross-time-zone teams keep work moving and can shorten development and release cycles by enabling work to continue across geographies.
- Direct Revenue Generation: Modern hubs co-build software, APIs, and IP that contribute directly to revenue.
- Faster AI Productization: Dedicated CoEs bring ML, data, and automation teams together to launch customer-facing AI faster.
Bottom-Line Efficiency Levers
- Labor & Operational Savings: GCCs in India can deliver 40%–60% lower fully loaded costs, depending on role, seniority, and location.
- Cutting Vendor Margins: Moving key workloads from third-party outsourcing into a captive or hybrid GCC can remove the external vendor margin embedded in recurring service fees.
- Reusing Platform Architecture: Centralized platforms reduce duplicate development and unnecessary technology spend.
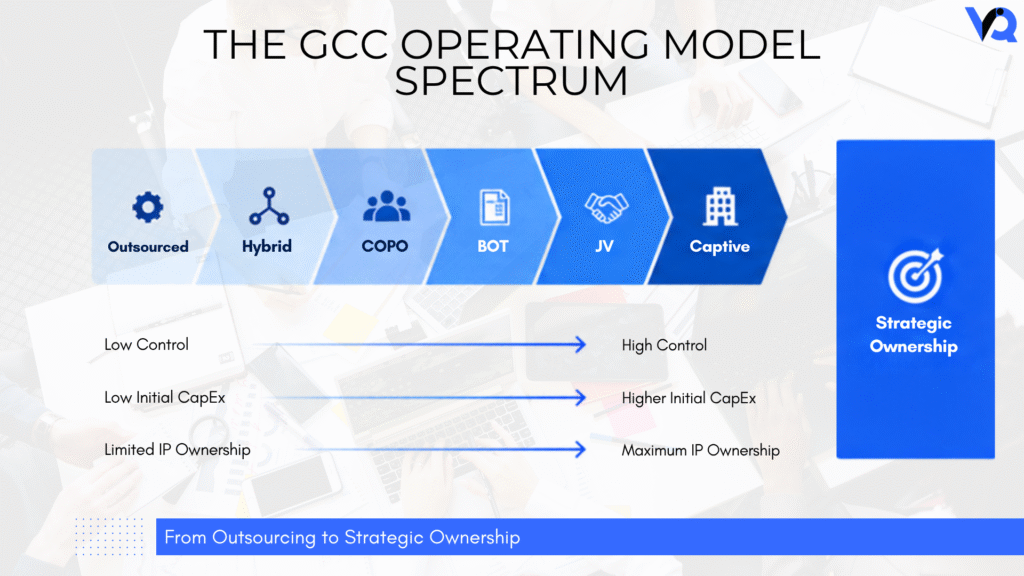
Choosing the Right Operating Model
How you structure your center dictates everything—from IP ownership and upfront capital requirements to how nimble you can be down the road:
Operating Model | Ownership & Governance | Primary Benefit | Key Trade-Off |
Captive (Wholly-Owned) | Wholly owned subsidiary of the parent company | Complete IP control and tight cultural alignment | Higher upfront costs ($3M–$15M+); takes longer to set up |
Build-Operate-Transfer (BOT) | Local partner builds and runs it, then hands over ownership | Fast local rollout; clear path to eventual ownership | Can get messy during the final handover phase |
Company-Owned, Partner-Operated (COPO) | You own the physical assets; a partner manages daily operations | Keeps asset and IP control in-house | Risk of friction over vendor management fees |
Hybrid / Multi-Site | Core work stays captive; vendor handles overflow | Balances strategic control with fast scaling | Harder to govern and manage across teams |
Joint Venture (JV) | Co-owned alongside a local strategic partner | Shared setup expenses and built-in local knowledge | Slower decision-making; needs constant executive alignment |
Outsourced (Third-Party) | External IT provider owns and manages everything | Minimal upfront CapEx; extremely fast hiring | Less control over innovation; recurring vendor margins |
Real-World Cost Benchmarks and Payback Timelines
Base engineering salaries are only part of the story. To understand the actual bottom-line impact, you have to look at fully loaded costs per engineer, which include base pay, benefits, real estate, hardware, cloud infrastructure, and local administration.
Note: These figures are directional planning guidelines. Final investments vary based on team size, target city, operating model, tech stack, infrastructure strategy, and regulatory needs.
Location Tier / Region | Indicative Fully Loaded Cost per Engineer (USD) | Net Savings vs. Primary US/EU Baseline |
Primary OECD Baseline (US / EU Hubs) | $150,000 – $220,000 | Baseline |
Host Country Tier-1 Metros (e.g., Bengaluru, Hyderabad) | $35,000 – $80,000 | 50% – 65% Savings |
Host Country Tier-2 Cities (e.g., Coimbatore, Vadodara) | $25,000 – $50,000 | 65% – 80% Savings |
Indicative fully loaded costs vary by role, seniority, location, infrastructure model, and overhead allocation.
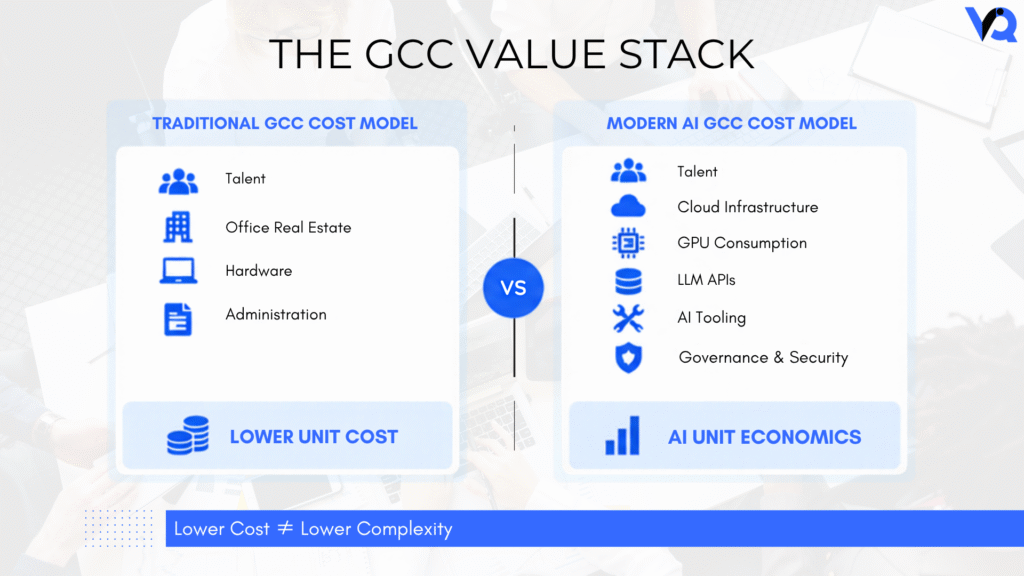
Avoiding the “AI Capex Trap”
Treating a modern GCC like an old-school IT helpdesk is a quick recipe for budget overruns. Generative AI and cloud-heavy workloads bring unexpected costs: unmanaged GPU consumption, ongoing LLM API calls, and specialized software licensing. Factoring these AI unit economics into your initial financial model keeps operational margins protected.
Break-Even Expectations
Getting a capability center off the ground typically calls for initial setup capital ranging from $500,000–$1.5 million for leaner setups (15–100 employees) to $15 million+ for massive corporate campuses. Most centers reach financial break-even within 2 to 3 years, generating compounding returns through long-term cost avoidance and reusable technical assets.
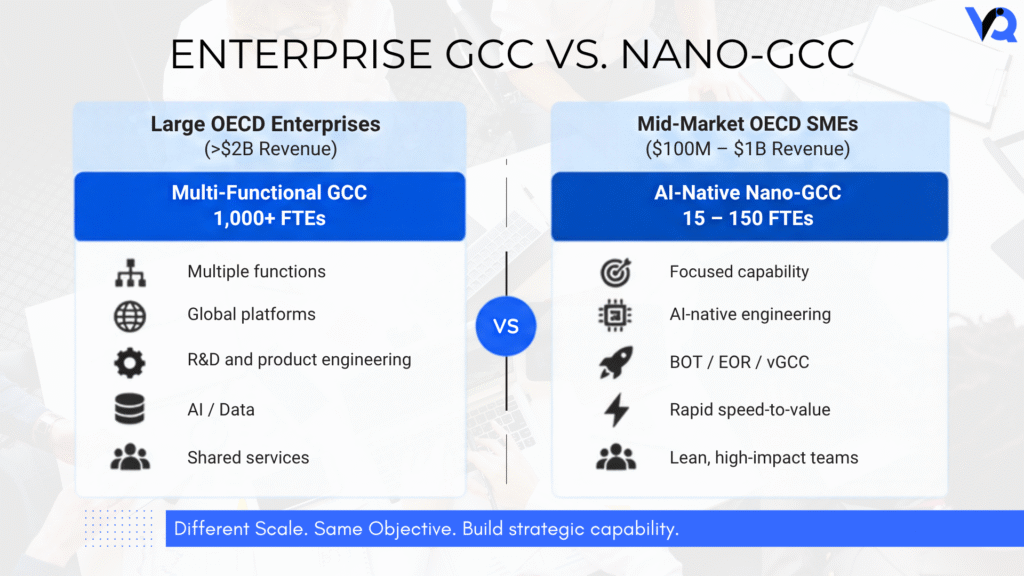
Size Matters: Global Multinationals vs. Mid-Market "Nano-GCCs"
Scale completely changes how you build and run a center:
The Enterprise Approach: The “10/30/50” Practical Framework
Large corporations making major investments in dedicated subsidiaries generally target three milestone thresholds:
- 10% of total global company leadership based at the GCC
- 30% of total corporate headcount working out of the center
- 50% of primary software and platform output built locally
The 10/30/50 framework is a VantageIQ strategic planning heuristic, intended to illustrate the potential scale and strategic importance of a mature GCC rather than a universal industry benchmark.
The Mid-Market Alternative: AI-Native “Nano-GCCs”
Mid-sized companies ($100M–$1B in revenue) rarely have the capital or immediate hiring needs to justify a 500-person campus. Below 30 to 50 employees, fixed legal, real estate, and administrative costs can quickly eat away at expected savings.
For the purposes of this framework, we use “Nano-GCC” to describe a focused capability unit of approximately 15–150 professionals.
To make the math work, mid-sized firms can use Nano-GCCs powered by Employer of Record (EOR) services, BOT partners, or Virtual GCC (vGCC) models. Equipping smaller engineering teams with modern AI coding tools can significantly increase their output, provided the underlying architecture, governance, and domain expertise are strong.
Strategic Consideration | Large Enterprises (>$2B Revenue) | Mid-Market Firms ($100M–$1B Revenue) |
Target Scale | Multi-functional hubs (1,000+ staff) | Compact, specialized units (15–150 staff) |
Upfront Capital Capacity | Comfortable funding $3M–$15M+ setup investments | Need low CapEx options ($500K–$1.5M setup) |
Speed-to-Value | Willing to spend 12–18 months setting up for total control | Need results quickly (3–6 months) |
Governance Needs | Dedicated global boards and tax compliance teams | Direct reporting lines to HQ department heads |
Preferred Setup | Wholly-Owned Captive or Strategic Joint Venture | Build-Operate-Transfer (BOT), EOR, or Virtual GCC |
Tax Risk, Transfer Pricing, and Corporate Exposure
As a center transitions from basic back-office support to creating core software and IP, cross-border tax scrutiny increases.
Transfer Pricing & Safe Harbour Rules
Transactions between parent companies and their offshore entities have to meet arm’s-length pricing standards, usually calculated via the Transactional Net Margin Method (TNMM).
India’s 2026 Safe Harbour framework provides a 15.5% operating-profit-to-operating-expense benchmark for qualifying IT services transactions, subject to the applicable eligibility conditions and revenue threshold.
Permanent Establishment (PE) Risks
If structured incorrectly, a GCC can create Permanent Establishment exposure for the foreign parent. The risk depends on the applicable tax treaty, the functions performed locally, contractual arrangements, authority exercised by local personnel, and how the Indian operation is structured.
Key areas to watch include:
Fixed-Place PE: Whether local premises are effectively available to and used by the foreign enterprise for conducting its business.
Service PE: Whether the applicable treaty contains service-PE provisions and whether the activities and duration satisfy those provisions.
Dependent Agent PE: Whether local personnel habitually conclude contracts or play the principal role leading to contracts on behalf of the foreign parent.
DEMPE Guidelines under OECD Rules
Under OECD Base Erosion and Profit Shifting (BEPS) guidelines, tax and transfer-pricing considerations follow where real economic decisions happen across DEMPE functions (Development, Enhancement, Maintenance, Protection, and Exploitation).
Where local teams perform significant IP development functions, the transfer-pricing characterization and allocation of profits may require closer examination by tax authorities.
Real Productivity Factors: Attrition and Local Autonomy
The Hidden Cost of Staff Turnover
While engineering attrition usually sits between 14% and 24% for specialized roles, the financial impact goes way beyond HR agency fees:
Real Cost of Turnover = Recruitment Fees + Onboarding Ramp Time + Lost Team Velocity + Unrecoverable Product Context + Project Delays
For a senior engineer making $75,000, replacing them directly might cost $15,000 to $20,000 on paper. But when you factor in lost velocity, team distraction, and delayed project timelines, the actual economic drag on the organization can be significantly higher.
Preventing HQ Bottlenecks
A major reason captive centers fail is simple friction: HQ micromanagement and long approval loops. To build a center that lasts, local leadership needs genuine Decision Autonomy.
In an illustrative productivity model, cutting out middle-of-the-night approval delays can give engineers back up to 1.25 hours of focused deep-work time every day, improving overall output and team satisfaction.
How Real Companies Are Doing It
- A.P. Moller – Maersk (Logistics): Built major technology hubs in India for container tracking, port logistics, and trade automation, strengthening internal engineering capabilities.
- Lululemon Athletica (Retail): Established a Bengaluru tech center supporting global e-commerce, inventory planning, and customer platforms as an extension of its Vancouver HQ.
- Continental AG (Automotive): Built technical centers focused on autonomous driving, vehicle software, AI, and cybersecurity, scaling R&D across global talent markets.
- Marriott International (Hospitality): Scaled Indian tech teams supporting global platforms, including reservations and the Marriott Bonvoy loyalty ecosystem.
- GE HealthCare (MedTech): Uses its Bengaluru technology center as a major global R&D hub, developing medical technologies and AI solutions for worldwide markets.
- Ferguson PLC (Industrial Distribution): Launched its Bengaluru technology center with ANSR to build capabilities across data, ERP, and e-commerce without creating every operational layer from scratch.
C-Suite Evaluation Checklist
Before greenlighting a GCC expansion or setup, leadership teams should run through these core checks:
- Topline & Bottom-Line Balance: Does the business plan balance clear cost savings (30% to 60%) with realistic goals for faster product delivery?
- Realistic AI & Cloud Budgeting: Do the financial projections cover cloud compute, GPU access, and AI tooling alongside employee salaries?
- Tax & Legal Setup: Are applicable transfer-pricing benchmarks, PE risks, and DEMPE guidelines properly documented to protect corporate IP?
- Turnover Impact & Autonomy: Does the business case account for the productivity and ramp-up costs of losing key engineering talent? Are local leaders empowered to remove daily approval bottlenecks?
The GCC Equation Has Changed
The math around Global Capability Centers has fundamentally shifted.
First-generation centers were built to save on labor costs.
Second-generation centers were built to access specialized technical capabilities.
Today’s best centers are built around ownership, owning products, platforms, decision-making, and intellectual property.
The ultimate value of a modern GCC isn’t just a lower cost base. It’s a faster, more capable global organization.
Designing and scaling a Global Capability Center requires balancing speed, cost, compliance, and talent retention.
VantageIQ Technologies partners with OECD enterprises through every stage of the GCC journey, from location selection and operating model design (BOT, EOR, Captive) to transfer pricing governance and AI-native engineering team builds.
Connect with our team to design your global capability roadmap.