


Building on our examination of long-term strategic shifts in chapter 8, this one looks at the definitive numbers behind India’s Global Capability Center (GCC) ecosystem: its scale, workforce, geographic footprint, economic value, talent economics, intellectual property, and operating models.
The numbers tell a different story from the traditional cost-arbitrage narrative.
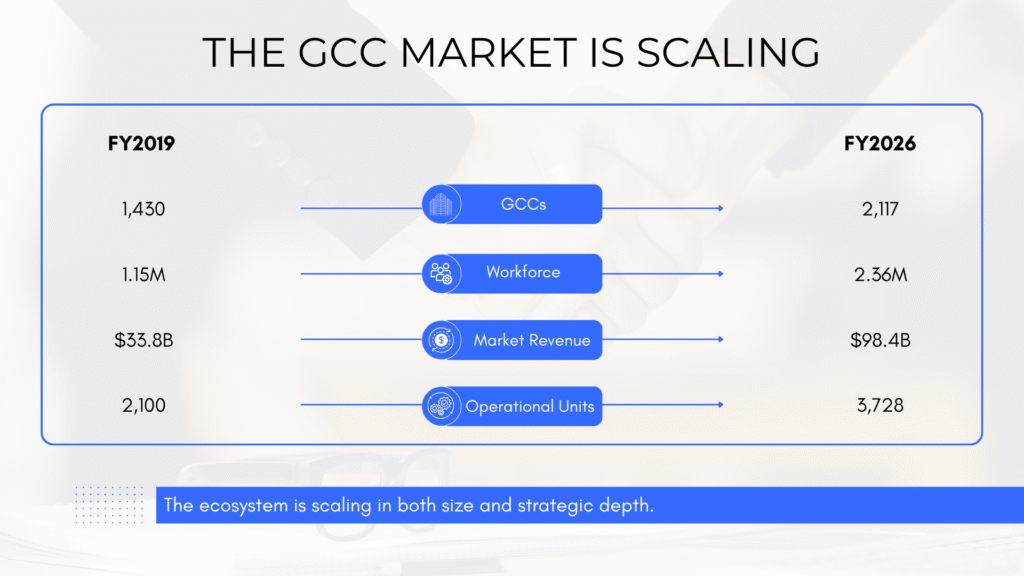
As of FY2026, India is home to 2,117 GCCs operating across 3,728 units, employing approximately 2.36 million professionals and generating an estimated $98.4 billion in GCC market revenue. The ecosystem has grown by approximately 32% since FY2021, while 506 Forbes Global 2000 companies now operate GCCs in India.
The scale is significant. But the more important shift is what that scale represents: increasingly specialized engineering, AI, product, analytics, finance, R&D, and enterprise functions being performed from India with global mandates.
The GCC conversation is moving beyond how many centers India can host. The more strategic question is how much global capability, product ownership, and enterprise decision-making those centers can absorb.
Macro Market Scale: The GCC Numbers Are Moving Fast
Between FY2019 and FY2026, the number of GCCs in India increased from approximately 1,430 to 2,117. The installed workforce has reached approximately 2.36 million, while annual GCC market revenue has reached $98.4 billion.
The scale of the research behind these figures is equally significant. The FY2026 Zinnov-NASSCOM landscape draws on 200+ primary interviews with GCC heads, CTOs and CHROs, analysis of more than 1 million GCC job postings, real-estate data across India’s major GCC cities, and a GCC tracking database maintained for more than two decades.
EY’s Future of GCCs in India – A Vision 2030 projected that the country could reach approximately 2,400 GCCs, 4.5 million professionals, and a $110 billion GCC market by 2030. These are projections rather than current commitments, and the pace of FY2026 growth makes the evolution of those forecasts worth watching.
GCC Ecosystem: Key Numbers
Metric | Earlier Benchmark | FY2026 | 2030 Outlook |
Active GCCs | ~1,430 (FY2019) | 2,117 | ~2,400 |
Operational Units | ~2,100 (FY2019) | 3,728 | — |
GCC Workforce | ~1.15M (FY2019) | 2.36M | 4.5M |
Annual GCC Revenue / Market Size | ~$33.8B (FY2019) | $98.4B | ~$110B |
Global 2000 Companies with GCCs | — | 506 | — |
PE-Backed / Acquired GCCs | — | 504 | — |
The 2030 figures above are based on EY’s Vision 2030 projection. The latest FY2026 Zinnov-NASSCOM data establishes the current baseline of 2,117 GCCs, 3,728 units, 2.36 million professionals, and $98.4 billion in revenue.
The next phase of growth is not simply about adding more centers. It is about determining what functions, products, technologies, and decisions those additional centers will own.
The Workforce: From Headcount to Capability Density
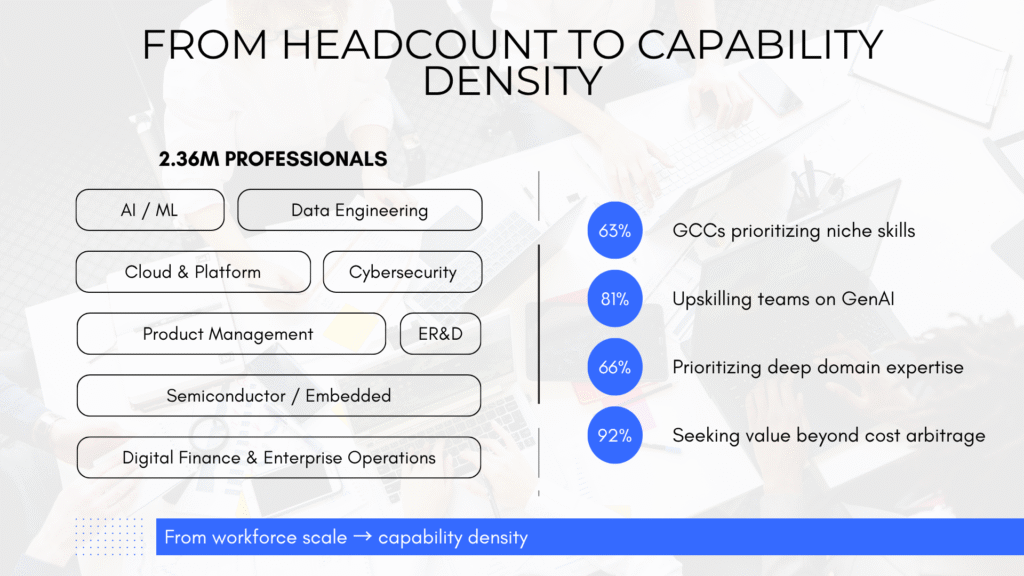
The Indian GCC workforce has reached approximately 2.36 million professionals. But raw headcount increasingly tells only part of the story.
The composition of GCC work is becoming more specialized across:
- AI and machine learning engineering
- Data engineering and analytics
- Cloud and platform engineering
- Cybersecurity
- Technical product management
- Semiconductor and embedded engineering
- Engineering research and development (ER&D)
- Digital finance and enterprise operations
The FY2026 Zinnov-NASSCOM landscape identifies India as the #1 AI hiring market globally, reinforcing the country’s increasing role in building AI capabilities for global enterprises.
EY’s 2025 GCC Pulse Survey provides another useful indicator of this shift. 63% of GCCs are prioritizing niche skills, while 81% are upskilling internal teams on GenAI. The survey also found that 66% are prioritizing deep domain expertise, alongside AI/ML and data engineering capabilities.
The strategic shift is visible in enterprise intent as well: 92% of surveyed GCCs aim to deliver value beyond cost arbitrage, while 87% expect to manage end-to-end processes for global enterprises over the following 12 months.
The more useful GCC workforce metric is increasingly not how many people are employed, but how much strategic capability each employee or team controls.
Where Are India's GCCs Located?
India’s GCC ecosystem remains concentrated in a handful of major metropolitan markets, but the distribution is becoming more diversified.
The latest Zinnov-NASSCOM FY2026 data tracks 3,728 GCC units across India. JLL’s 2026 GCC analysis shows that established hubs continue to dominate, with Bengaluru accounting for 34%–39% of overall GCC activity, Hyderabad for 20%–23%, and Pune for 15%–20%.
The Major GCC Hubs
- Bengaluru: Remains India’s largest GCC cluster, with 900+ GCC units according to JLL. Its strengths span technology, ER&D, BFSI, AI, product engineering, cloud, and semiconductor-related capabilities.
- Hyderabad: Captures 20%–23% of national GCC activity, with strong concentrations in healthcare and life sciences, technology, BFSI, analytics, and enterprise platforms.
- Pune: Commands approximately 15%–20% of national GCC activity, with particular strength in BFSI, automotive engineering, ER&D, industrial technology, and embedded systems.
- Chennai: Continues to strengthen its position as a manufacturing and automotive hub, complemented by IT/ITeS, BFSI, and ER&D capabilities.
- Delhi NCR: Has evolved into a corporate-services powerhouse spanning IT, BFSI, e-commerce, retail, healthcare, consulting, and education.
- Mumbai: Remains India’s commercial and financial-services center, attracting strategic GCCs in banking, financial services, capital markets, and enterprise functions.
The geographic concentration is also visible in office demand. In Q1 2026, Bengaluru accounted for 24.8% of India’s total office leasing, followed by Mumbai at 19.5%, Hyderabad at 16.8%, Pune at 14.5%, and Delhi NCR at 14.2%.
Why Tier-2 Cities Matter
The geographic story is no longer limited to the traditional metros. Coimbatore, Ahmedabad/GIFT City, Kolkata, Vadodara, Kochi, Mysuru, and other emerging locations are increasingly appearing in GCC location strategies.
JLL estimates that Tier-II locations can offer approximately 10%–35% cost savings while providing access to additional talent pools. Its 2026 analysis also identifies Ahmedabad, Kolkata, Jaipur, Coimbatore, Mysuru, and Kochi as emerging business hubs.
The emerging model is not simply Tier-1 versus Tier-2. Enterprises are building distributed portfolios—placing global leadership, architecture, and product ownership in established hubs while using emerging cities for specialized engineering and functional capacity.
Which Industries Are Building GCCs?
GCC mandates increasingly reflect the strategic priorities of their parent enterprises rather than a single generic delivery model.
Major Industry and Functional Areas
- BFSI & Insurance: Core banking technology, risk analytics, quantitative research, cybersecurity, payments, regulatory technology, and capital markets platforms.
- Healthcare & Life Sciences: Clinical data, healthcare analytics, AI-enabled research, medical technology, regulatory operations, and pharmaceutical R&D.
- Retail & Consumer: Supply-chain technology, pricing systems, e-commerce architecture, customer analytics, and inventory optimization.
- Manufacturing, Automotive & Industrial: Embedded software, connected vehicles, EV technology, digital twins, industrial automation, and engineering R&D.
- Technology & Telecom: Cloud platforms, cybersecurity, AI infrastructure, software engineering, network technologies, and digital platforms.
- Enterprise Functions: Finance, HR, procurement, tax, risk, legal operations, marketing, and global business services.
EY’s 2025 GCC Pulse Survey found Finance present in 79% of surveyed centers, IT in 78%, Data Management & Analytics in 69%, HR in 65%, Supply Chain in 54%, AI in 52%, and ER&D in 41%.
The numbers reveal an increasingly multi-functional model: technology capabilities are being built alongside finance, HR, supply chain, R&D, risk, legal, and other enterprise functions rather than in isolation.
GCC Scale: Bigger Does Not Always Mean More Strategic
India’s GCC ecosystem spans massive global hubs as well as highly specialized teams.
| GCC Archetype | Indicative Scale | Typical Mandate | Examples |
|---|---|---|---|
| Enterprise GCC | 10,000+ staff | Multi-functional global capability | Walmart Global Tech, JPMorgan Chase, Microsoft |
| Medium GCC | 1,000–10,000 staff | Product, engineering, and functional ownership | Mercedes-Benz R&D, Siemens, Bosch |
| Small GCC | 100–1,000 staff | Specialized business or technology capability | AstraZeneca, Philips, Target |
| Micro GCC | <100 staff | Niche AI, data, engineering, or R&D capability | Early-stage/expanding GCCs of SaaS, fintech, and deep-tech enterprises |
According to the FY2026 GCC landscape, 583 mid-market GCCs and 504 PE-backed GCCs represent important segments of the market, demonstrating that the ecosystem is not being built exclusively around the largest multinational centers.
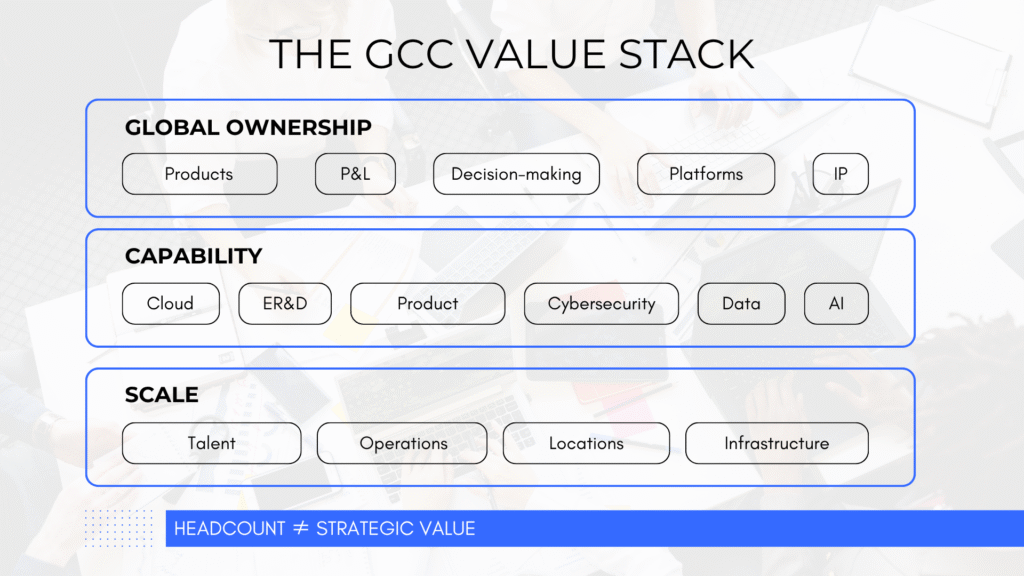
Headcount is an incomplete measure of strategic value. A smaller GCC owning a critical AI, cybersecurity, product, or engineering capability can have significantly greater enterprise leverage than a much larger transactional operation.
What Does GCC Talent Cost?
GCCs compete for experienced professionals across global enterprises, technology companies, startups, and traditional IT services firms. This makes compensation one of the clearest indicators of where scarce capability is being concentrated.
Indicative Compensation Benchmarks (LPA) by VantageIQ Technologies
Career Discipline | 1–5 Years | 6–10 Years | 11–15+ Years |
Software Engineering | ₹10–28 LPA | ₹30–48 LPA | ₹48–75 LPA |
Cloud & DevOps Architecture | ₹12–28 LPA | ₹35–55 LPA | ₹58–85 LPA |
Data Engineering | ₹12–28 LPA | ₹34–55 LPA | ₹55–85 LPA |
AI / ML / GenAI | ₹14–32 LPA | ₹48–72 LPA | ₹78–120 LPA |
Technical Product Management | ₹12–28 LPA | ₹28–58 LPA | ₹60–90 LPA |
Cybersecurity | ₹11–27 LPA | ₹40–65 LPA | ₹50–85 LPA |
(Note: Indicative VantageIQ market benchmarks. Actual compensation varies by city, enterprise, domain specialization, seniority, equity participation, and skill scarcity.)
These indicative benchmarks are based on VantageIQ Technologies’ experience working with and supporting multiple GCCs, providing practical visibility into compensation patterns across specialized technology roles and experience levels.
As GCC mandates move toward AI, product ownership, engineering, and specialized domain capabilities, compensation increasingly reflects capability scarcity rather than generic labor availability.
The talent equation is also changing on the retention side. EY’s 2025 survey found GCC attrition falling to 9%, down from 13% in 2023 and 11% in 2024.
The Cost of a GCC Is More Than Salary
Salary is only one component of GCC unit economics. EY’s Vision 2030 research projected that the overall cost per GCC FTE could rise from ~$29,100 to $37,760 by 2030, reflecting real estate, infrastructure, travel, statutory benefits, and operating overheads.
At the same time, GCCs are modifying their relationship with third-party service providers. EY’s 2025 GCC Pulse Survey found that 84% of GCC operations remained in-house, while 12% were outsourced and 4% followed a hybrid model. Outsourcing increased from 8% in 2024 to 12% in 2025, indicating that GCCs selectively use external partners for non-core capacity or specialized needs.
The survey also found that GCCs are directing 25% of their budgets toward technology and transformation and 23% toward talent and workforce, showing where enterprises are placing their incremental investment.
This creates a structured operational division:
- Core capability: Retained internally within the GCC
- Specialized capacity / acceleration: Handled by external partners
- Transactional work: Selectively outsourced
- Strategic IP & enterprise ownership: Retained inside the enterprise
The GCC model is not necessarily about eliminating service providers. It is about deciding which capabilities the enterprise must own directly and where external partners can accelerate execution.
The Real Estate Footprint Reflects Long-Term Commitment
GCC growth is directly visible in India’s commercial real estate market:
- 2025 Leasing: GCCs leased approximately 31.3 million square feet of office space across India’s top seven cities, accounting for 38% of gross office leasing activity—the highest annual GCC leasing volume recorded by JLL.
- Q1 2026 Leasing: Momentum accelerated, with GCCs taking 45.5% of gross office leasing activity, equivalent to approximately 9.8 million square feet, up 43% year-over-year.
- Bengaluru: GCCs accounted for approximately 70% of the city’s gross leasing activity in Q1 2026, demonstrating how heavily the city’s office market is being shaped by global capability expansion.
Global enterprises are making substantial, multi-year physical commitments to campuses and operational hubs across India.
The Innovation Ecosystem Behind India's GCC Advantage
India’s broader innovation ecosystem provides important context for the growing R&D and technology mandates of GCCs.
NASSCOM’s Patent Pulse 2025 reported 86,000 AI-related patent filings in India between 2010 and 2025, with filings during 2021–2025 seven times higher than during 2010–2015. 63% originated in India, while Generative AI accounted for 28% of filings and machine learning exceeded 55%.
These are India-wide figures, not GCC-specific patent counts, but they reflect the innovation ecosystem available to enterprises building advanced capabilities in the country.
At the broader innovation level, WIPO’s Global Innovation Index 2025 ranks India 38th among 139 economies, up from 48th in 2020.
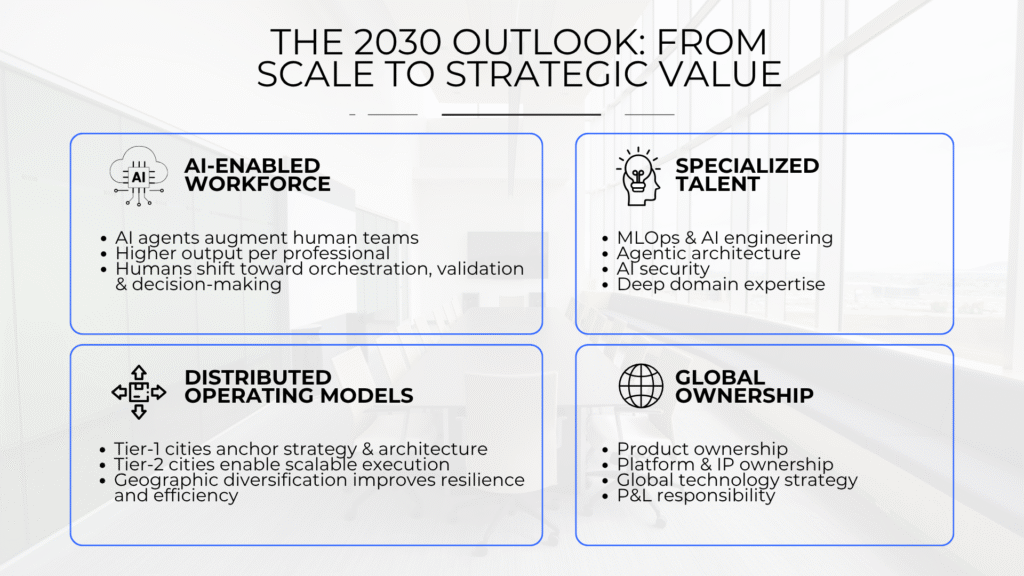
For GCCs, the implication is clear: India’s advantage is increasingly about more than technical talent, it is the depth of the surrounding AI, engineering, research, and innovation ecosystem.
The next GCC maturity benchmark is not simply how many engineers a center employs, but how much proprietary technology, research, and global decision-making those teams can influence and own.
Strategic Outlook
The baseline metrics frame the current landscape:
- 2,117 GCCs operating across 3,728 units
- 2.36 million professionals
- $98.4 billion GCC market revenue
- 506 Forbes Global 2000 companies
- 1,200+ GCCs with embedded AI/ML capabilities
- 31.3 million sq. ft. of office space leased by GCCs in 2025
- 9.8 million sq. ft. leased by GCCs in Q1 2026 alone
- 86,000 AI patent filings in India between 2010 and 2025
Looking ahead to EY’s 2030 projections of 2,400 GCCs, 4.5 million professionals, and a $110 billion market, India’s GCC ecosystem is becoming denser, more distributed, and more deeply integrated into global corporate agendas.
The defining GCC metric of the next decade will not be headcount, it will be how much of the global enterprise is being designed, built, and directed from India.
Execute Your GCC Roadmap with VantageIQ Technologies
Turning these market trends into a high-performing GCC requires clear choices around location architecture, talent composition, operating models, technology capability, partner strategy, and governance.
VantageIQ Technologies helps global enterprises design, launch, and scale capability centers in India, from operating-model decisions and team architecture to specialized technology capability building.
Connect with our team to build your GCC operating blueprint.